How to read your asset allocation
Asset allocation describes how you divide your investments among asset classes. The SEC explains how the mix you choose depends on when you need the money and your ability to tolerate losses. To read your current mix, start with the value of each holding on the same date.
Choose which accounts belong in the portfolio you are reviewing. For this exercise, include investments and the cash set aside for investing. Convert foreign holdings into the same currency before adding the values.
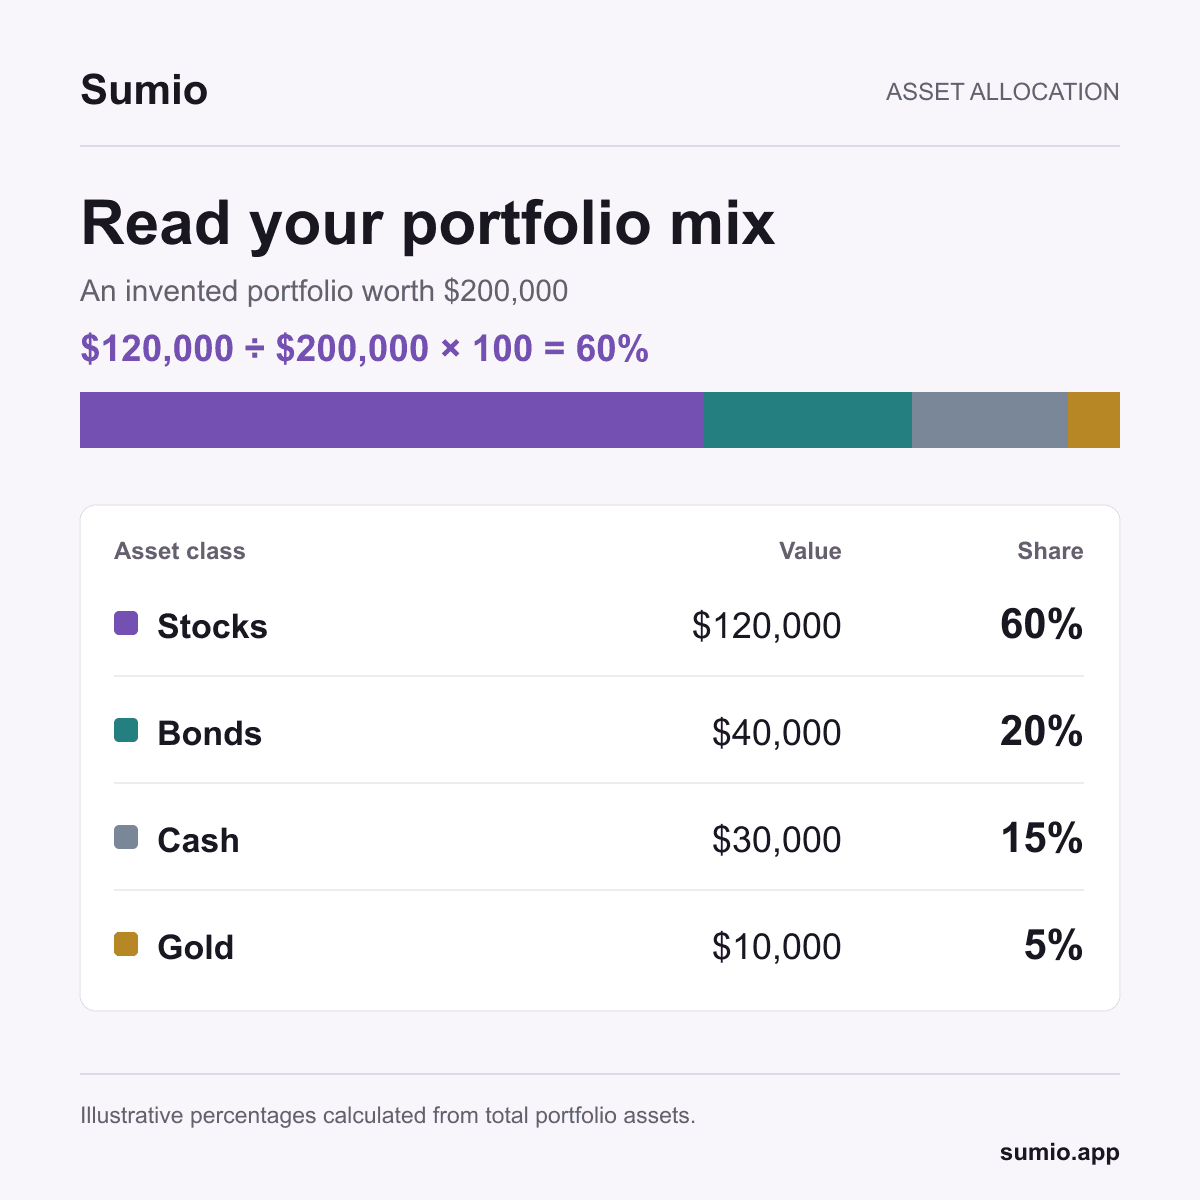
Divide each category's value by the portfolio total, then multiply by 100. With the invented figures below, stocks account for $120,000 of a $200,000 portfolio, or 60%.
| Asset class | Value | Share |
|---|---|---|
| Stocks | $120,000 | 60% |
| Bonds | $40,000 | 20% |
| Cash | $30,000 | 15% |
| Gold | $10,000 | 5% |
To choose your own mix, write down the date you expect to start spending this money and consider how a fall in its value would affect that plan.
A 401(k) can hold stock funds alongside bond funds, so use the fund breakdown to classify the money. For a fund that combines asset classes, such as a target date fund, consult its latest published allocation and split the value accordingly. For an invented $10,000 holding with 80% in stocks, assign $8,000 to the stock category. Use the fund breakdown to assign the remaining $2,000, keeping the sum equal to the holding’s value.
Sumio shows charts for how your assets are distributed across categories. Review how you have grouped your entries before reading the chart, especially when a single account holds several types of investment.
If only the stocks in our example rise to $132,000, the portfolio totals $212,000 and stocks make up 62.3%, rounded to one decimal place. That scenario assumes unchanged holdings and fixed values for the other assets. Save the date and category totals so you can compare the mix at your next review.